Home › Trading Guides › RSI Trading Strategy
RSI Trading Strategy: Expert Guide 2026
Leverage relative strength to secure your market entry
Definition | Zones 70/30 | Differences | Lower Division | Breeder Division | Comparison | Settings | Errors
RSI trading strategy Discover in this comprehensive 2026 guide how to master the RSI indicator to improve your market entries. The strategy is based on... disagreements is much more reliable than simple overbought and oversold zones.
Definition and Operation of the RSI
Le RSI (Relative Strength Index), The Relative Strength Index (RSI) is a technical oscillator developed by J. Welles Wilder in 1978. This indicator has become one of the most widely used tools by traders worldwide.
The RSI measures the speed and magnitude of recent price movements to assess whether an asset is potentially overbought or oversold. It is a oscillator terminal which evolves on a fixed scale from 0 to 100.
The RSI Formula
RSI = 100 - (100 / (1 + RS))
Or RS (Relative Strength) represents the ratio between the average of increases and the average of decreases over the selected period. By default: 14 periods.
Interpretation of Values
- + RSI greater than 70 : "Overbought" zone. The price has risen rapidly.
- + RSI between 30 and 70 : Neutral zone.
- + RSI less than 30 : Area of "oversales". Significant selling pressure.
Why 70/30 Zones Are Unreliable

Use of terminals 70 and 30 to identify flow depletion.
The basic idea seems logical: buy when the RSI falls below 30 and sell when it rises above 70. Unfortunately, this simplistic approach is one of the most common mistakes among novice traders.
The Major Problem
You never really know when the price will turn around. within these zones. An RSI can remain in overbought territory for days, or even weeks, while the price continues to rise.
Why is it risky?
- - Strong trends ignore extreme areas : RSI can remain above 70 for a long time.
- - No precise timing Knowing that an asset is "overbought" does not tell you WHEN it will correct.
- - Frequent false signals : In a range, the RSI enters and exits extreme zones repeatedly.
- - Context ignored : An RSI of 25 in a bear market does not necessarily mean a rebound.
The Differences: The Most Reliable Method
If you only remember one technique, it's the one about disagreements. Unlike 70/30 zones which provide static information, divergences provide dynamic information on the actual exhaustion of momentum.
A divergence occurs when the price and the RSI move in different directions. opposite directions. This shift is a strong signal that the current trend is losing momentum.
Why Divergences Are More Reliable
- + Confirmation signal The momentum is really losing steam.
- + Best timing They form just before the reversal.
- + Filter against false signals : Eliminates many bad trades.
- + Works in all contexts Effective in both trending and range-bound markets.
Bearish Divergence

The price is rising while the RSI is falling, signaling an imminent reversal.
A bearish divergence occurs when the price marks a new high, but the RSI simultaneously records a lower high than the previous one.
How to Identify It
- + Step 1 : Identify an initial peak in price accompanied by a peak in the RSI.
- + Step 2 : Wait for the price to form a second, higher peak.
- + Step 3 : Check that the corresponding RSI is LOWER than at the first peak.
- + Step 4 The divergence is confirmed. Prepare a short position.
Bullish Divergence
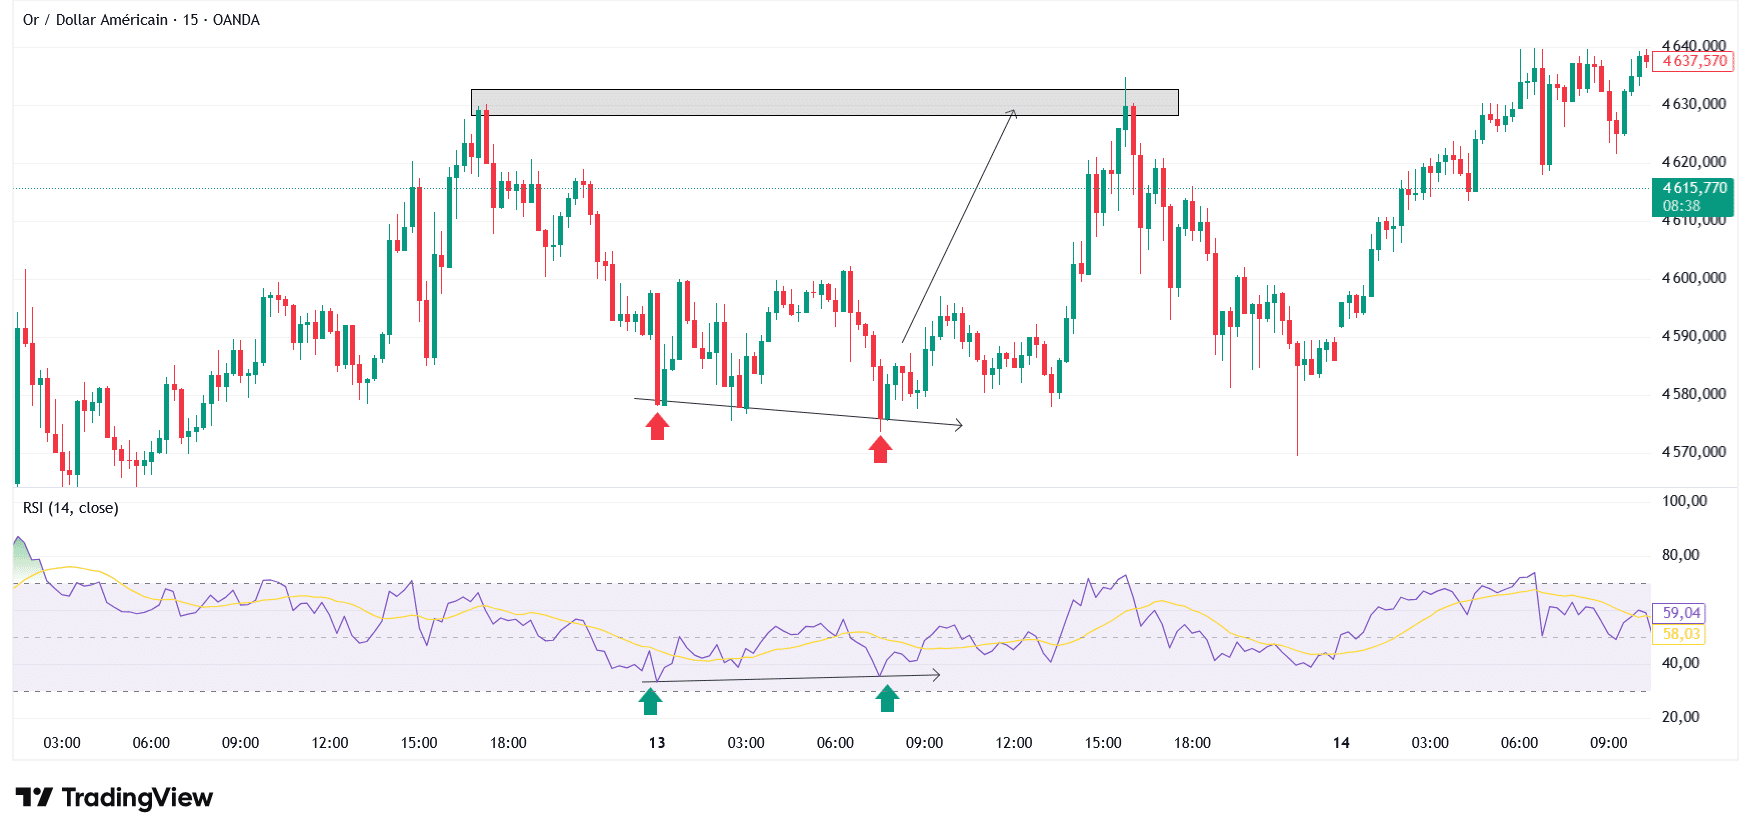
Precise buy signal on Gold thanks to the detection of a bullish divergence in the RSI.
La bullish divergence This is the favorite signal of traders seeking optimal entry points. It forms when the price registers a new low, but the RSI draws a higher low.
This configuration indicates that despite the price drop, selling pressure is weakening. This is often a harbinger of a powerful bullish reversal.
Comparison: Extreme Zones vs. Divergences
| Criteria | Zones 70/30 | Differences |
|---|---|---|
| Reliability | Low to medium | Raised |
| Timing | Imprecise | Accurate |
| False signals | Many | Rare |
| Strong trend | Ineffective | Effective |
| Risk/Reward Ratio | Poor | Excellent |
Optimal settings according to your style
RSI 7 Periods - Short Term
More responsive, ideal for the scalping and day trading. Generates more signals but also more noise.
RSI 14 Periods - Standard
Optimal balance between responsiveness and reliability. Recommended for the swing trading.
21-Period RSI - Long Term
Smoother, filters out walking noise. Perfect for... positions of several weeks.
Common Mistakes to Avoid
5 Costly Mistakes
- - Trading extreme zones as automatic signals : An RSI of 75 or 25 is not an input signal.
- - Ignoring the prevailing trend : A bullish divergence in a strong downtrend can fail.
- - Look for differences everywhere Focus on the clear and obvious differences.
- - Neglecting risk management Even the best signal can fail. Use stop-loss orders.
- - Over-optimizing the parameters Constantly changing settings leads to mediocre performance.
Combining RSI with Other Indicators
Recommended Confluences
- + RSI + Support/Resistance levels : Bullish divergence on a major support level = powerful signal.
- + RSI + Moving Averages Confirm the trend direction before trading.
- + RSI + Chart Patterns Double bottom + bullish divergence = high probability.
- + RSI + Volume : Divergence confirmed by a decrease in volume = strengthened signal.
Conclusion
The RSI remains one of the most powerful technical indicators in 2026. However, its effectiveness depends entirely on how you use it. Zones like 70/30 are not reliable signals.
True power lies in the disagreements between price and momentum. These divergences offer optimal entry points with an excellent risk/reward ratio.
For precise technical analysis, use the tools of TradingView, the reference for configuring your RSI indicators.
Related Articles
- Comparison of the Best Brokers 2026
- Moving Averages Guide
- Fair Value Gap Guide (FVG)
- Free Forex Lot Calculator
Warning : Trading involves the risk of capital loss. 74-89% retail accounts lose money. Only invest what you can afford to lose.