Home › Trading Guides › Moving Averages Strategy
Moving Averages Strategy: Expert Guide 2026
Master market cycles and secure your entries with trend indicators
Definition | Types of MM | MM100 and MM200 | EMA Fan | Crossings | Comparative | Errors | Settings
Whether you are a beginner or an experienced trader, the moving averages They represent a fundamental pillar of technical analysis. In this comprehensive guide, we will explore this legendary indicator, its different variations, and the most effective strategies for using it on a daily basis.
What is a Moving Average?
A moving average is a technical indicator that calculates the average price of an asset over a given period. Its main objective is to smooth out price fluctuations to reveal the underlying market trend.
In practical terms, a moving average shifts over time: with each new candlestick, it recalculates the average by incorporating the latest data point and excluding the oldest. This is what gives it its "moving" character.
The Different Types of Moving Averages
The 4 Main Types
- + SMA (Simple Moving Average) : Arithmetic mean of prices. Each price has the same weight. The most basic and most used.
- + EMA (Exponential Moving Average) Gives more weight to recent prices. More responsive to changes. Preferred by active traders.
- + WMA (Weighted Moving Average) : Decreasing linear weight at old prices. Compromise between SMA and EMA.
- + SMMA (Smoothed Moving Average) Longer smoothing period. Very smooth curl for the long term.
In most of moving averages strategy In modern systems, the EMA is preferred because it reacts more quickly to trend reversals.
Identify the trend using the 100-day and 200-day moving averages.
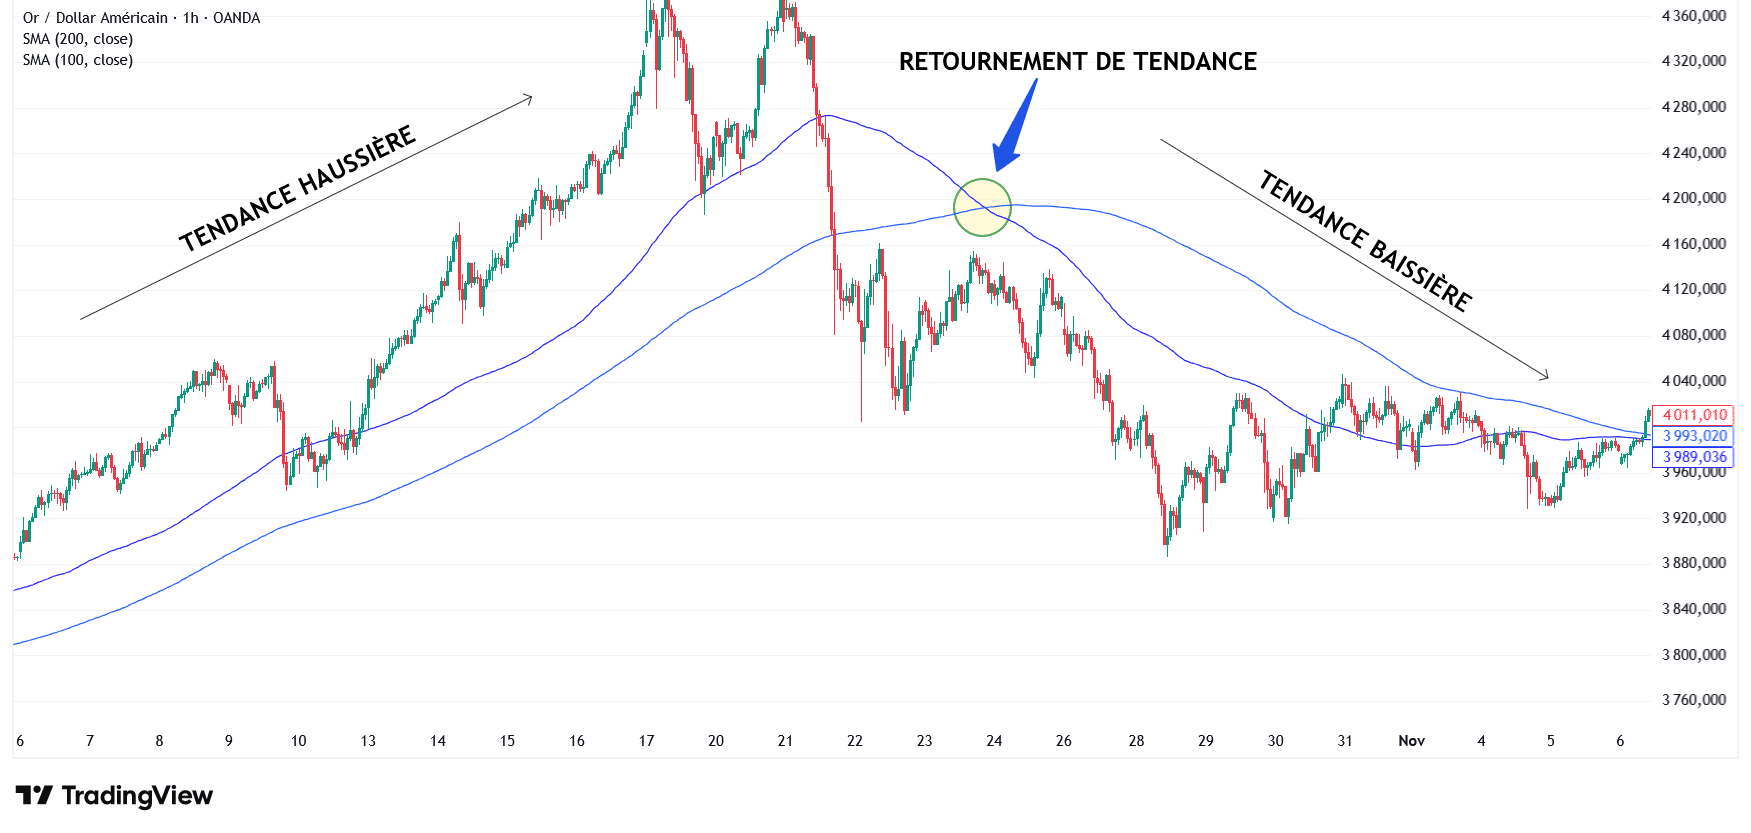
To establish a clear and institutional view of the market, the 100 and 200-period moving averages are the global benchmarks. These long-term moving averages define whether the market is structurally bullish or bearish.

The dynamic support offered by the 100 and 200 moving averages on Gold (XAUUSD).
Interpretation of the MM200
- + Price above the MM200 Bullish structure. Favor buying.
- + Price below the MM200 : Bearish structure. Favor sales.
- + Price close to the MM200 Major decision zone. Possible rebound or break.
The Fan Technique with EMA 3, 18 and 31
One of the most powerful techniques is the use of a fanned EMA system. This method combines three exponential moving averages: EMA 3, EMA 18 and EMA 31.

The fan technique with EMA 3, 18 and 31 on WTI oil.
Bullish alignment
When the three EMAs line up in order EMA 3 > EMA 18 > EMA 31, They form a "fan" that opens upwards:
- + Input signal : Crossing of EMA 3 above EMA 18, then EMA 18 above EMA 31.
- + Position maintenance : As long as the order remains intact (3 > 18 > 31), the trend is valid.
- + Support area Pullbacks towards the 18 or 31 EMA offer buying opportunities.
Bearish Alignment
Conversely, when the order is reversed with EMA 3 < EMA 18 < EMA 31, The fan opens downwards:
- + Sales signal : Crossing of EMA 3 under EMA 18, then EMA 18 under EMA 31.
- + Short support As long as the bearish order is respected, the sellers retain control.
- + Resistance zone : Rebounds towards the 18 or 31 EMA offer selling opportunities.
Pay attention to the compression phases
When the three EMAs converge and intertwine, the market enters a consolidation phase. Avoid trading during these periods. Wait until a new, clear fan pattern forms.
Crossovers as Trading Signals
Moving average crossovers are one of the most popular signals in technical analysis.
Crossing flows indicate major psychological shifts in the market.
The Golden Cross (Golden Cross)
Le Golden Cross This occurs when a short-term moving average crosses above a long-term moving average. It is a major bullish signal.
- + Classic configuration : The MM50 crosses above the MM200.
- + Interpretation Buyers are regaining control.
- + Action : Buy signal or reinforcement of long positions.
The Death Cross
Le Death Cross This is the opposite of the Golden Cross. The short-term moving average crosses below the long-term moving average.
- + Classic configuration : The MM50 crosses below the MM200.
- + Interpretation The sellers are taking control.
- + Action : Signal to sell or exit long positions.
Comparison of Periods and Uses
| Period | Type of analysis | Use | Reactivity |
|---|---|---|---|
| EMA 3-9 | Very short term | Scalping, fast signals | Very high |
| EMA 18-21 | Short term | Day trading, swing court | High |
| EMA/SMA 50 | Medium term | Swing trading | Average |
| SMA 100 | Long term | Intermediate trend | Weak |
| SMA 200 | Very long term | Underlying trend, institutional | Very weak |
Common Mistakes to Avoid
5 Costly Mistakes
- - Trading range crossovers : Moving averages generate many false signals in trendless markets.
- - Using inappropriate time periods : An EMA 5 on a weekly chart makes no sense.
- - Ignoring the overall context A Golden Cross over 15 minutes does not have the same value as on the daily chart.
- - Entering too late : Crossovers are lagging indicators.
- - Neglecting risk management Even the best signal can fail. Always place a stop-loss order.
Recommended settings according to your style
Scalping
EMA 3, 8, 21 on M1 to M15 charts. Look for fan alignments for quick trades.
Day Trading
EMA 9, 21, 55 on M15 to H1 charts. Combine with the MM200 to define the directional bias.
Swing Trading
EMA 21, SMA 50, SMA 200 on H4 to D1 charts. Favor pullbacks towards the 50-day moving average in the direction of the 200-day moving average.
Long-Term Investment
50-day, 100-day, and 200-day moving averages on weekly charts. Buy above the 200-day moving average, sell if there is a Death Cross.
Conclusion
The moving averages They remain one of the most powerful indicators in 2026. Their apparent simplicity hides great versatility: trend identification, trading signals, dynamic support/resistance levels.
True power lies in the intelligent combination of different periods. The range EMA 3/18/31 is particularly effective for defining market direction. Long-term averages (MM100 and MM200) provide the institutional context, while short-term averages offer the timing.
For precise technical analysis, use the tools of TradingView, the global reference for setting up your moving averages.
Related Articles
Warning : Trading involves the risk of capital loss. 74-89% retail accounts lose money. Only invest what you can afford to lose.